The Brainstorm
- GRR's blog

- Mar 13, 2014
- 5 min read
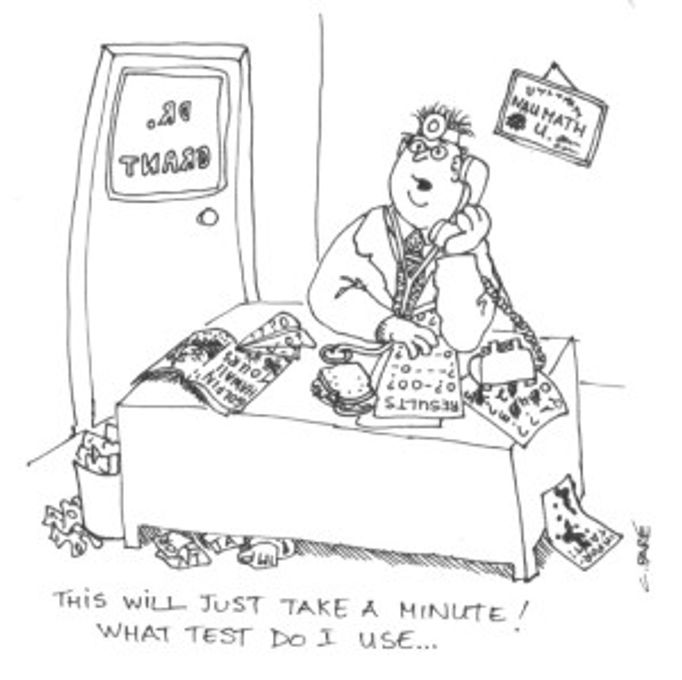
Data Analysis Hell
It’s where grad student go to cry – data analysis. Just saying it out loud makes me cringe. One of the things that makes data analysis so hard is deciding which statistical test to do. The specifics of my data dictate what approach should be taken and it’s easy enough to read a text book or look online to figure out what test looks like it will work. Then I run it in the stats program, and it comes up with a bunch of errors. Most of those errors don’t really make sense when I read them because they were written by people who know what they are doing, and let’s face it, I don’t really know what I’m doing. All I do know is that I can’t have any errors on the statistical output because that basically means the data doesn’t work with that test. But why? So I go back to the internet and the textbooks and see how my data doesn’t apply, or how I don’t have enough data, or my data is written in the wrong font, or I can only run the test when it’s sunny outside and it’s raining, or when I run the test I have to spin my office chair around three times and say “I love stats” for it to work.
Ok… maybe it’s not that arbitrary, but it feels like it.
This process of running tests and getting errors and figuring out why and fixing that and running the test again can go on for days (no lie). That’s data analysis hell.
Then I had a meeting with my supervisor and learned I had been trying to run the wrong test the whole time. Hence all the error messages. “Your data won’t work with that test”, he said. I KNOW! That’s been the problem. So I ran the right test, and the output was…
Exactly opposite what I hypothesized. Awesome.
When your bears aren’t doing what they’re supposed to be doing
Oh those grizzly bears! Statistical nightmares! They’re all individuals, so it becomes hard to pool data and talk about “males” and “females”, or “adults” and “subadults”. They all make decisions based on their individual lives – what happened to them earlier that day/week/month/year, what other bears are around and what is their relationship with them, how hungry they were, how tired they were. You thought humans were complicated, well at least you can ask a person how they are feeling. Grizzly bears get reduced to a series of numbers in a series of columns on a massive Excel spreadsheet that I have to run stats on to discern any patterns.
Based on the work that many biologists (who are way smarter than me) have done on grizzly bears over the years, I developed a series of hypotheses of what those patterns might be. I don’t expect my results to vary too much from the work that’s already been done, but I do expect my results to add to that work. And then I got an output that was opposite to everything I had ever read or expected. Huh? Sometimes, I just have to scratch my head and walk away from the computer.
When the statistical output isn’t what I expected, I have to figure out why. There are basically two reasons: either I haven’t done the statistical test correctly (this could mean the type of test, the variables included/excluded, and my interpretation of the output), or I’ve actually discovered something new that I didn’t expect to see. It is critical to thoroughly examine the first option from every possible angle before assuming the second to be true. Finding something new is great – but proclaiming I’ve found something new without being able to definitively prove that could be pretty detrimental to my career and reputation. Not to mention how it could potentially impact management of the very grizzly bears I’m working to conserve.
So I went back to the statistical test and identified some other ways to look at the data, some ways to change the variables and how they are defined. I ran another series of tests… and it spit back an output opposite to what I expected.
Awesome. So… More head scratching…
Then, I fell in love with my project all over again.
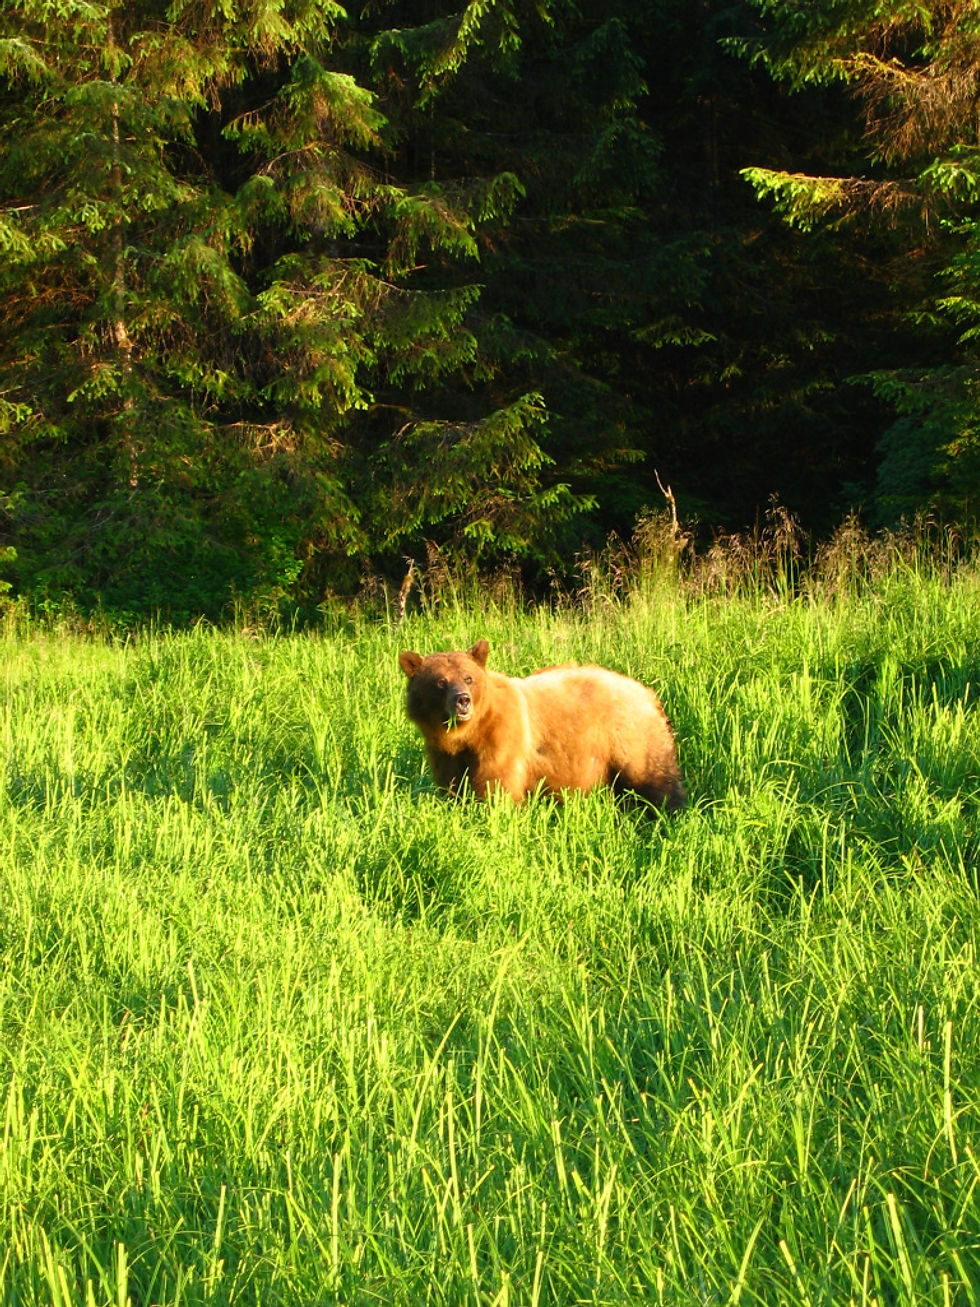
It’s a good job they’re so cute, because they’re a statistical nightmare!
Brainstorming and Trouble Shooting
This is the part I love. The problem solving. The thinking. The brainstorming. Throwing ideas out there, no matter how random or crazy and just wondering if they are even possible. And if they are possible, how would the data reflect that? What would I need to show that idea to be true or not true?
This is where supervisors come in, and I’m lucky to have a great team supporting me.
I took my preliminary outputs to my main supervisor and we started brainstorming why I might be seeing what I’m seeing. We talked about other statistical tests and options and the details of the test I had run already to make sure I hadn’t missed any glaringly obvious mistakes. Then we started asking each other why. Why would the bears be doing that? Why would they be over there? What are the implications of that? We ended up on a tangent talking about past management actions and how that might be reflected in the current data. We got very excited and I remembered what’s great about research – it’s actually incredible when my data doesn’t do what I expect, because I am reminded that I’m working with wild animals in a wild ecosystem and we don’t know everything about it. That’s why I’m researching it. I like not knowing everything. I like that the bears in my study aren’t doing everything I expect them to do (even if that would be statistically easier). It’s up to me to try and understand why they do what they do, not up to them to conform to some expectation I have of their behaviour.
Bears will be bears and data will be data. Data analysis and interpretation is a test in letting go of expectation, embracing the unpredictable, and dissecting a problem until it’s no longer a problem. And that is why doing research is rad. It’s not easy and it can be frustrating, but I love the creativity behind good research.
Moving forward
I know that I’m in the preliminary stages of analysis, which is why this post isn’t sharing any of the results. I still have a long way to go before I can share anything concrete, and what I end up sharing could be totally different from what I’m finding now. Maybe with more data from this summer and some more complex models in AcrGIS, I’ll find something else and my results won’t be so different after all. But maybe they will… And that possibility makes me smile. Either way, whatever I find will get us one step closer to better understanding grizzly bear habitat use in one of the busiest National Parks in Canada. And that is already awesome.
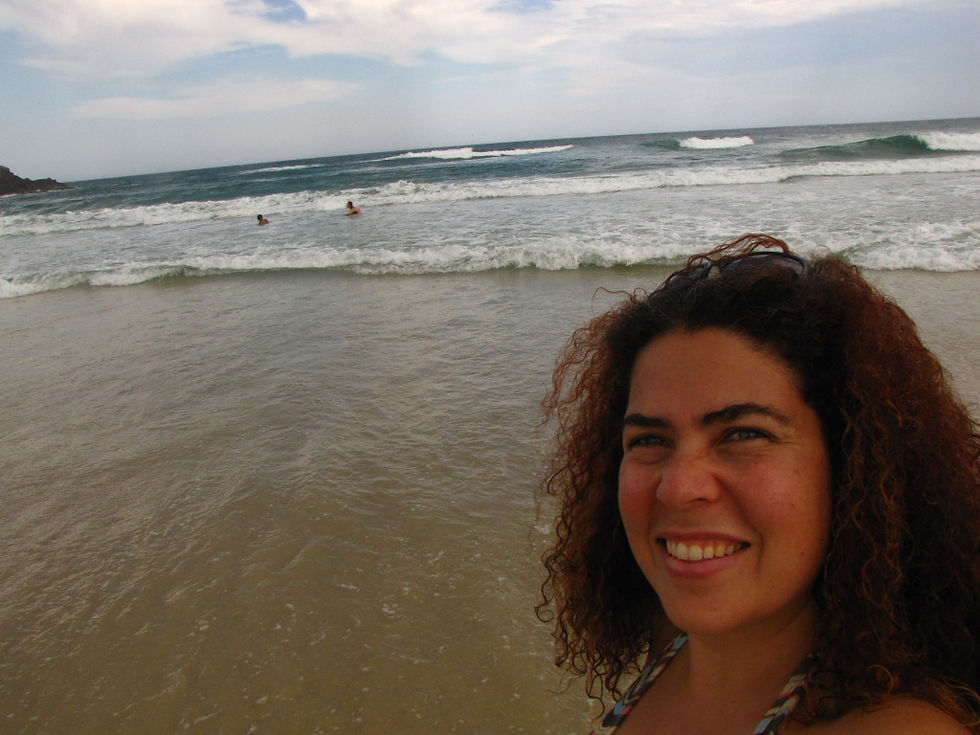
It’s also an awesome project because I get to spend most of the data analysis time in Australia… and there’s an ocean there… and it’s never -20!


Comments